Record High Mortgage Debt Sounds Scary. Here’s What the Headlines Leave Out.
You may have seen the headlines lately about mortgage debt in America hitting a record high. And maybe your brother-in-law brought it up at the dinner table like he’s been waiting all week to spark a debate.
Here's the thing. He's not wrong. But he only has half the story. And the half he's missing? It changes everything.
Spoiler: homeowners are on stronger footing than the headlines suggest, and the housing market has more going for it than most people realize.
The Headline Number Is Real, But It’s Missing Context
Yes, according to the Federal Reserve, there is currently about $14 trillion in mortgage debt in the United States. That is an all-time high. And when you hear that alongside stories about people struggling to pay their bills, it's easy to assume the worst.
But here's what the data actually shows (see graph below):
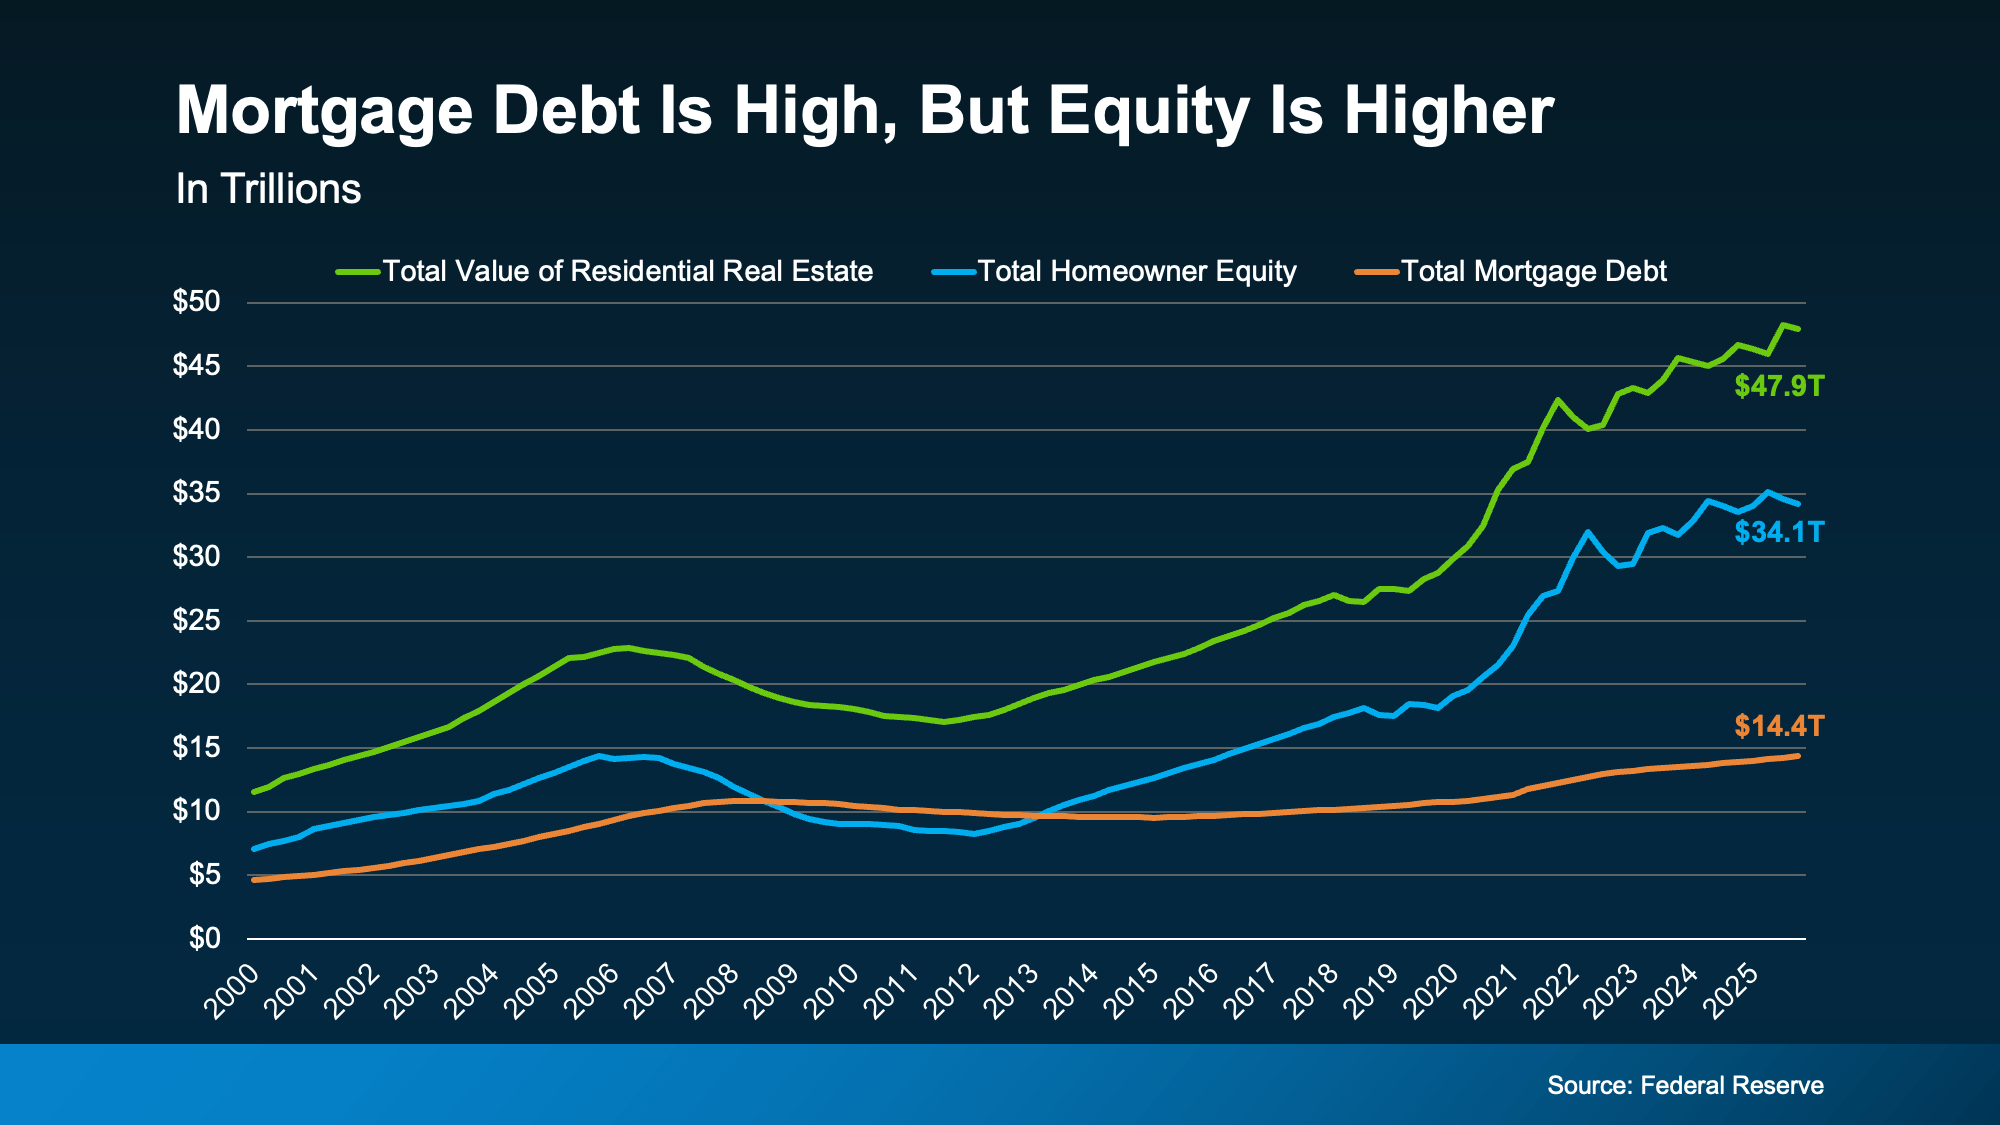 This chart from the Federal Reserve tracks three things from 2000 to today: the total value of all U.S. homes (the green line), the equity homeowners hold in those homes (the blue line), and the total mortgage debt owed on them (the orange line).
Right now, home values sit at $47.9 trillion. Homeowner equity is at $34.1 trillion. And the mortgage debt everyone’s worried about? It’s $14.4 trillion.
Debt is at a record high, sure. But the equity homeowners have built up is more than double that number, and it’s also near a record high.
Here's the part worth pausing on. See the years between 2008 and 2013 where the orange line was higher than the blue one? That's when the housing market was in genuine trouble. When debt exceeds equity like it did back then, homeowners have no cushion.
So, when prices dropped in 2008, millions of people owed more than their homes were worth and had nowhere to go. That's what a housing crisis actually looks like. That's not what's happening today. Right now, it’s just the opposite.
The gap between what people owe and what they own has never been wider – in a good way. Today, they have far more equity than debt.
Most Homeowners Are in a Rock-Solid Position
So, we know equity is high nationally. But what does that actually look like at the individual homeowner level? This next chart uses data from ATTOM and the Census to put it in perspective:
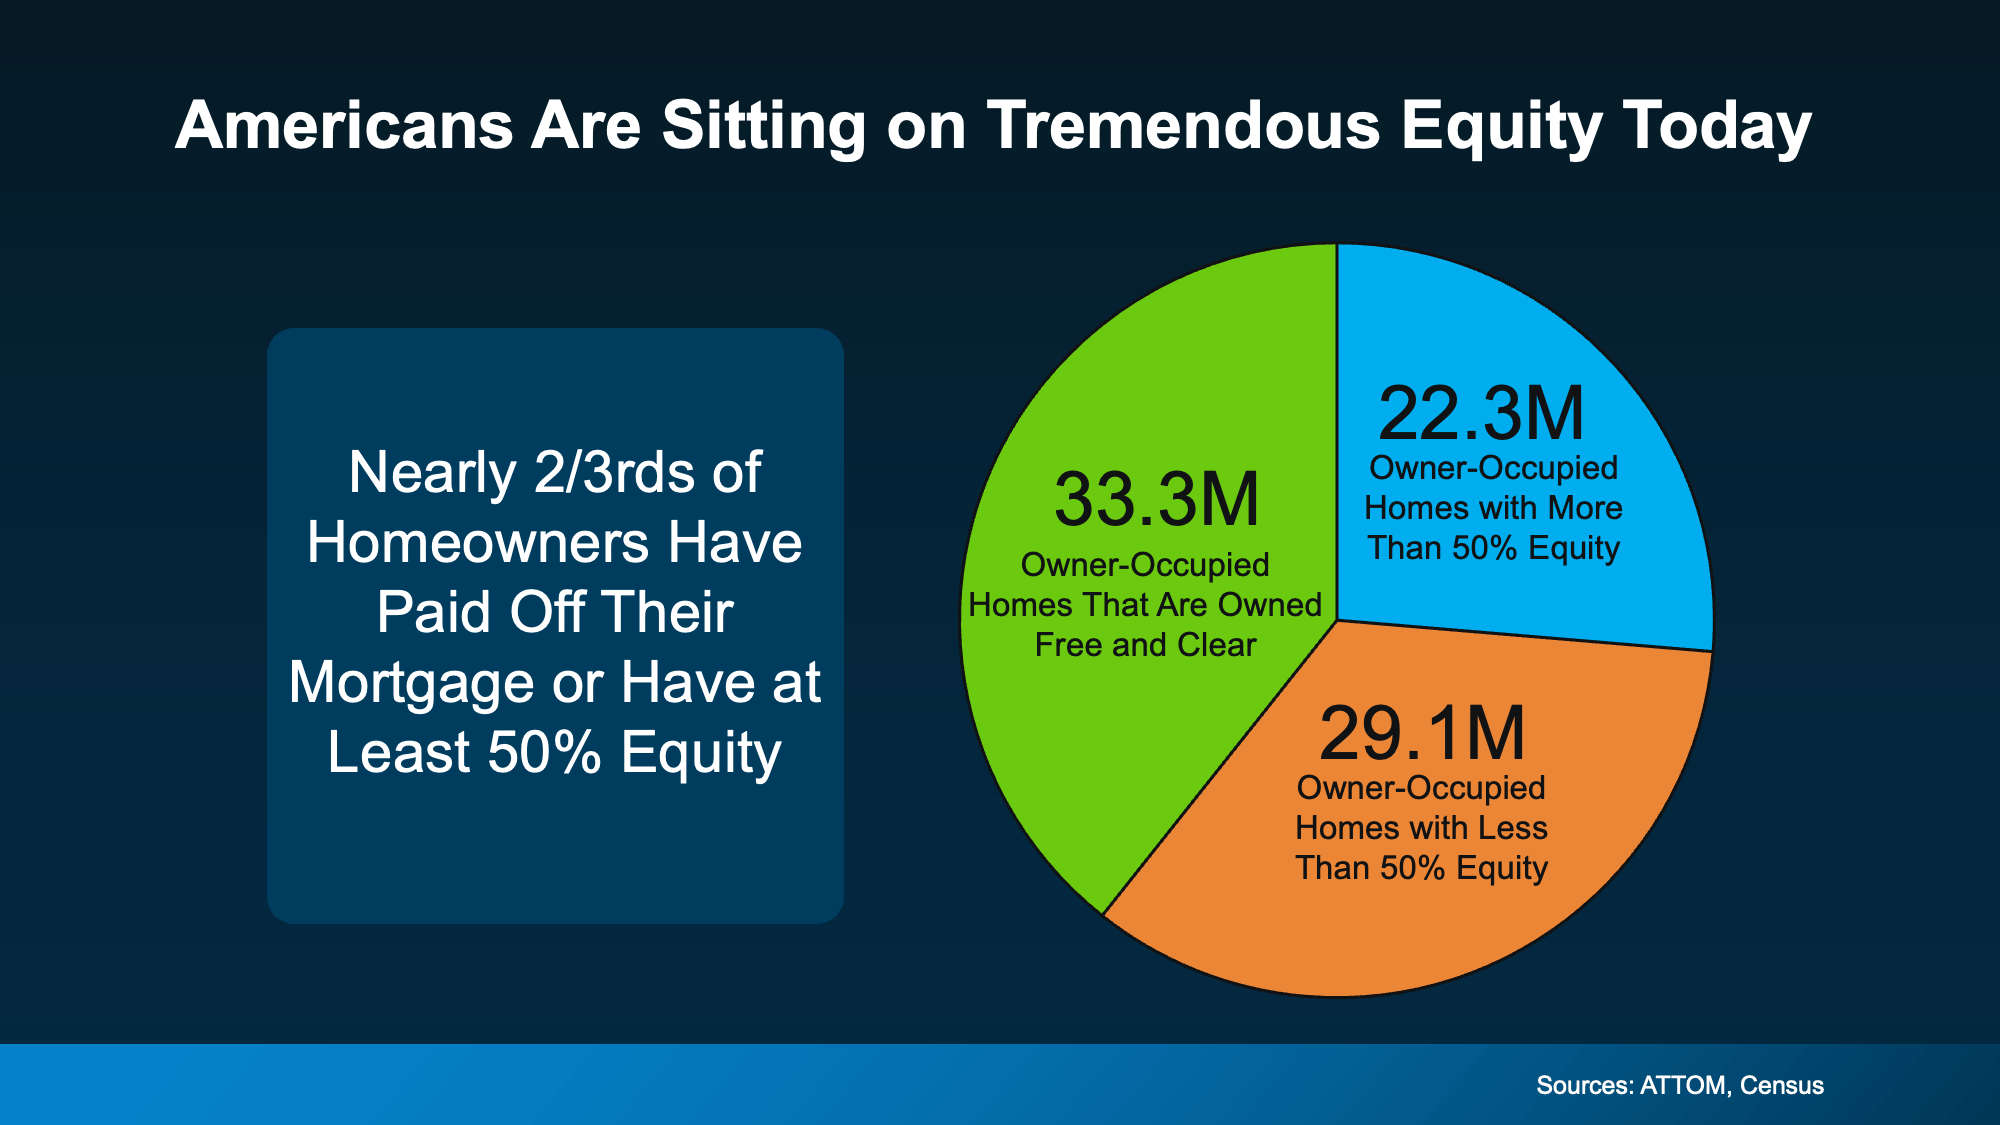 Out of all owner-occupied homes in the country, 33.3 million are owned completely free and clear – no mortgage, no lender, no risk of foreclosure. Another 22.3 million homeowners have more than 50% equity in their homes.
Add those together, and you're looking at nearly two-thirds of all homeowners who have either paid off their mortgage entirely or have such a substantial equity stake that they're in an extremely stable position.
The remaining slice – 29.1 million homes with less than 50% equity – isn't a sign of distress, either. That includes plenty of people who recently bought, are building equity over time, and are doing just fine.
The point is this isn't a market teetering on the edge. It's a market built on an unusually strong foundation.
Bottom Line
Record mortgage debt makes for a scary headline. But context matters.
Equity is near an all-time high, home values have surged, and the vast majority of homeowners are in a position of real financial strength. The conditions that made 2008 a crisis simply don't exist right now.
If you're wondering what all of this means for your situation, whether you're thinking about buying, selling, or just trying to make sense of the market, reach out anytime. No pressure, just answers.